E104 - Correlation
You are encouraged to familiarise yourself with a few topics prior to the exercise. The background section will provide you with some basic information and pointers. The exercise itself is designed to give you some practice in working with these concepts to give you a more intuitive grasp of them. The teacher will be able to supervise your during the exercise and explain the underlying theory if uncertainties remained during your preparation for the exercise.
Background
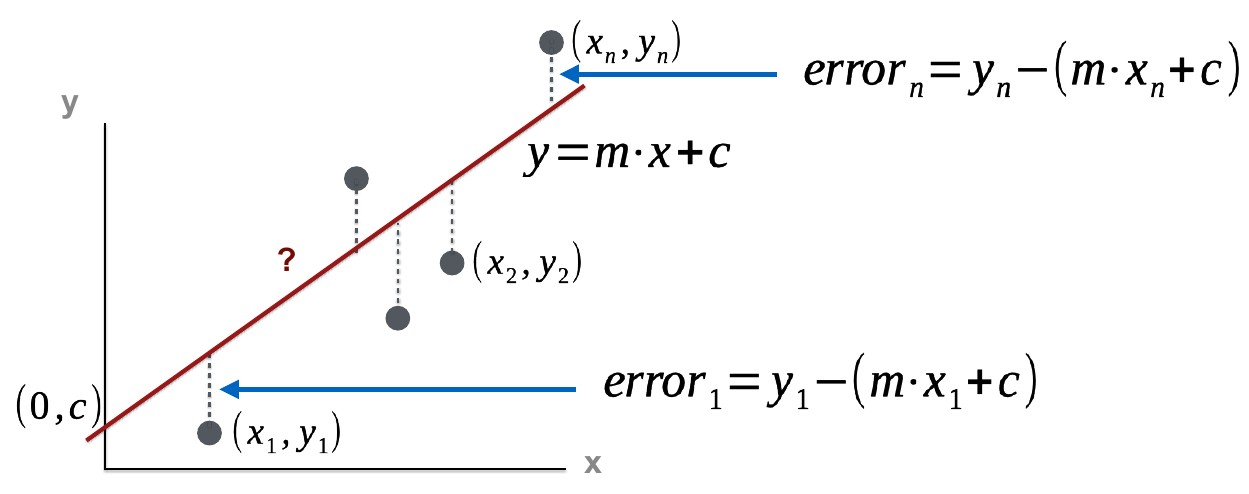
Topic 1: First, (re-)familiarise yourself with basic (ordinary least squares) regression and concepts of sum of squared errors on the regression line, the coefficient of determination.
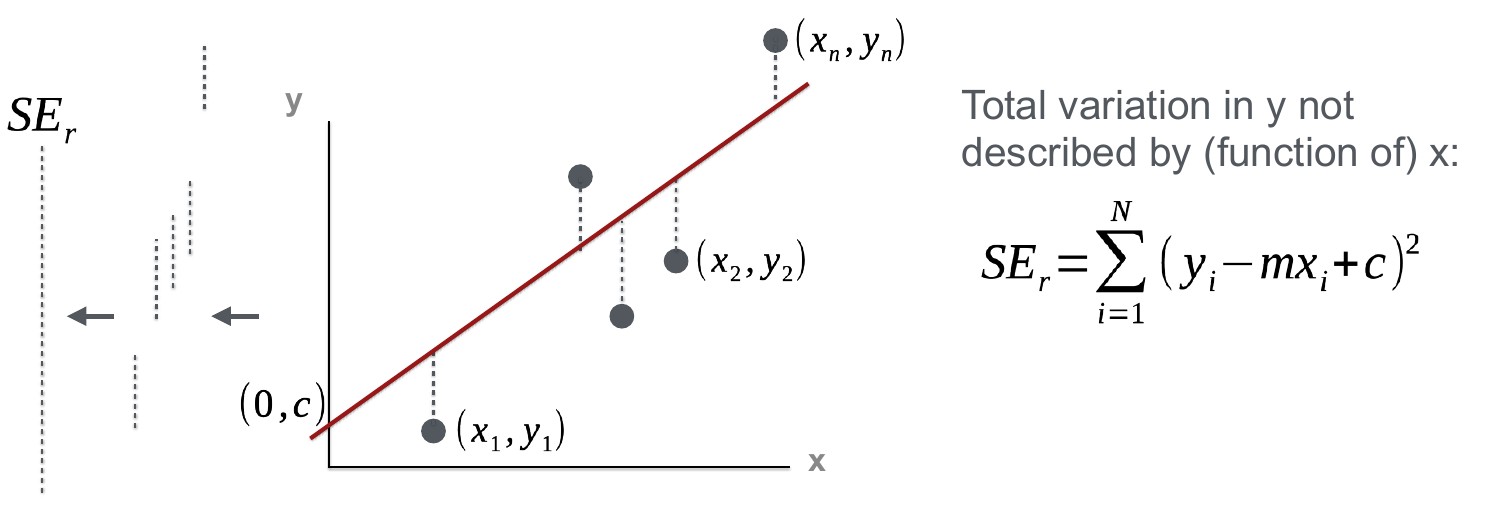
By the end of your studies, you should understand the following figures and labels:
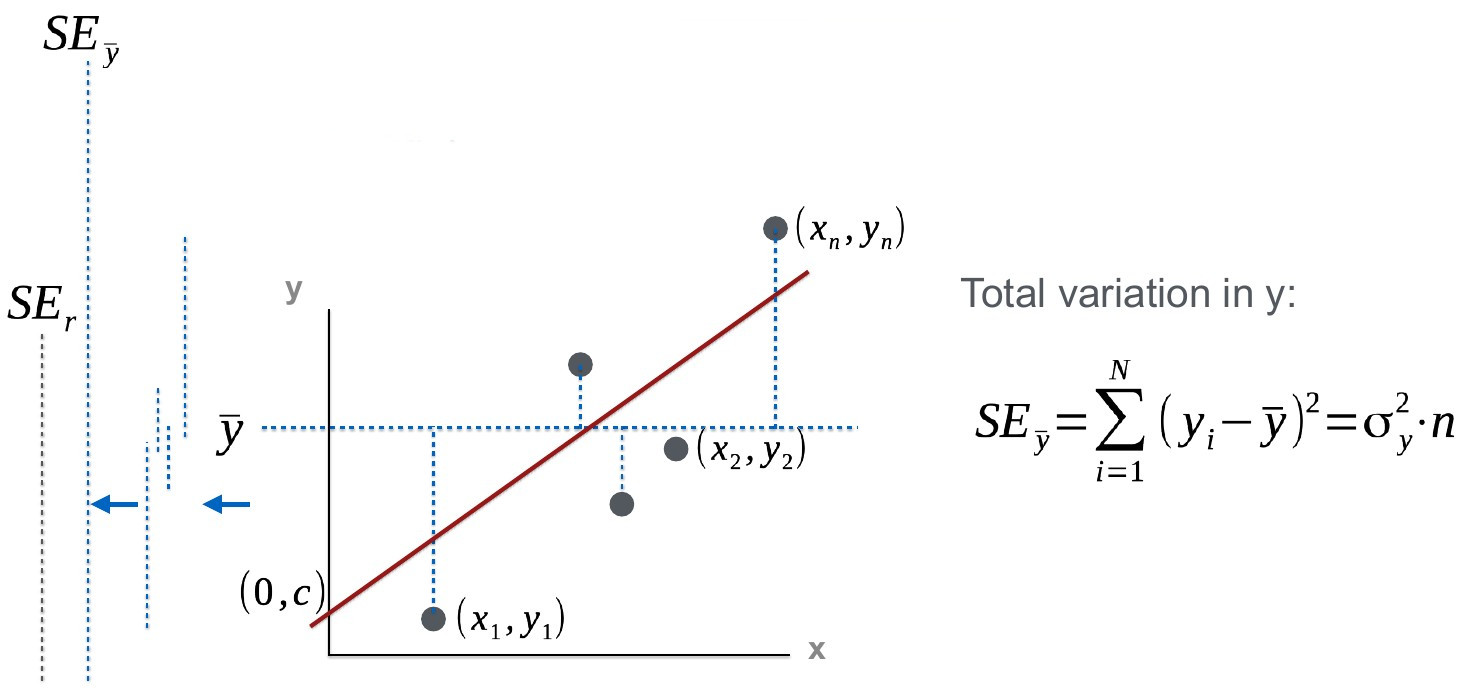
Furthermore, you will be able to interpret these last 2 figures and their relevance to the coefficient of determination:
Topic 2: Now have a closer look at covariance and correlation. How is covariance related to the slope of the regression line?
Topic 3: Finally, have a look at the Pearson correlation coefficient and Spearman rank correlation. What are their differences? What are their strenghts and weaknesses?
A conceptual understanding of pricipal component analysis (or empirical orthogonal functions) is not required for the exercise, but will allow you to understand one of the provided datasets better.
Exercise
Information
Topic |
|
|---|---|
Skills |
|
Investigating Statistical Dependence
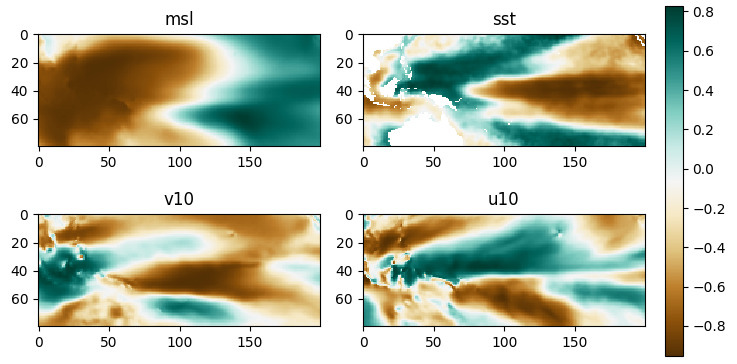
Eigenvector loadings: Mean sea level pressure (top left), sea surface temperature (top right), meridional 10m wind speed (bottom left) and zonal 10m wind speed patterns associated with ENSO. [From Mutz et al. 2021, supplemental file.]
The El Nino Southern Oscillation directly and indirectly controls much of regional climates elsewhere. You want to conduct simple tests to investigate the statistical relationship between ENSO, quantified by the multivariate ENSO index, and the climate specific locations.
You are provided with ERA-Interim re-analysis data extracted for three different (southern hemisphere) locations with different latitudinal and similar longitudinal coordinates:
Central Chile:
Antofagasta.cvs
Central-South Chile:
Quintero.cvs
South Chile:
Puerto_Montt_el_Tepual.cvs
Furthermore, a time series of the Multivariate ENSO Index (MEI) and Antarctic Oscillation Index (AAOI) is provided, which are based on EOF-analysis conducted on ERA-Interim data.
Note
This the MEI is computed from different variables and represents ENSO variability over time. The AAOI represents the expansion and contraction of the belts of Westerlies in the southern hemisphere and thus the frontal systems.
Choose three variables from the datasets and investigate their correlation with the variability of ENSO and seouthern hemisphere Westerlies. How much do the correlation coefficients differ? Are they significant? Do you see a pattern in dependence and does this make sense given what you know about climate?
HINT
Think about how seasons will affect your quantification of statistical dependence and think of a way to circumvent problems that may arise from this.
Think about different ways to quantify statistical dependence and how to implement code for it. Is there a way you can use previous code as modules/components for your computations here?
Warning
Late submissions won’t be accepted!